It would be very interesting to learn more about the processing of The vOICe complex sounds by the human hearing system. The vOICe goes well beyond the use of the spectral envelope to trace out (the edges of) object shapes, and seeks to induce a full spectral-temporal integration by the human brain to arrive at a form of mental synthetic vision.
One (and ultimately decisive) approach is to perform direct psychoacoustic experiments with human volunteers, involving all the intricacies of dealing with human variability. Another approach is to make use of computer models developed for the simulation of the various stages in human auditory processing. Again, these models should themselves have been validated against measured human performance during their development, such that we may have some confidence in their accuracy and/or predictive value. Given these premises, using auditory models at least has the advantage of quickly giving a first impression of what-to-expect, thus helping to reduce the risks before deciding whether to embark on a much more elaborate (time-consuming, and expensive) evaluation with human subjects.
Roy Patterson and colleagues at the Centre for the Neural Basis of Hearing
in the Physiology Department of the University of Cambridge, UK, have developed
a time-domain model of auditory processing to simulate the auditory images
produced by complex sounds. This
![]() Auditory Image Model (AIM,
formerly available from the
Auditory Image Model (AIM,
formerly available from the ![]() University of Cambridge)
simulates how sound waves cause basilar membrane motion (BMM) in the human cochlea.
Subsequently, the results are used as input for a next stage in which the
conversion, by haircells, of motion into a neural activity pattern (NAP) in the
auditory nerve is simulated. Finally, AIM maps the neural activity pattern to an
auditory image of the sound. On this page, we will consider how the first two
stages of AIM respond to The vOICe's soundscapes. The
University of Cambridge)
simulates how sound waves cause basilar membrane motion (BMM) in the human cochlea.
Subsequently, the results are used as input for a next stage in which the
conversion, by haircells, of motion into a neural activity pattern (NAP) in the
auditory nerve is simulated. Finally, AIM maps the neural activity pattern to an
auditory image of the sound. On this page, we will consider how the first two
stages of AIM respond to The vOICe's soundscapes. The
![]() original AIM software package
is available for download, and all other necessary information to reproduce the following experiments
is available on this site.
original AIM software package
is available for download, and all other necessary information to reproduce the following experiments
is available on this site.
DSAM (![]() Development
System for Auditory Modelling) contains a more recent implementation of the
AIM model for various computer platforms, including Microsoft Windows. DSAM is
available from the Department of Psychology at the University of Essex, UK.
Development
System for Auditory Modelling) contains a more recent implementation of the
AIM model for various computer platforms, including Microsoft Windows. DSAM is
available from the Department of Psychology at the University of Essex, UK.
 |  |
The 64 × 64 pixel Fourier reconstruction was created by The vOICe
Java application from the arti2ear.wav soundscape file, again using 64 frequencies
exponentially distributed in the range [500Hz, 5kHz]. It should be stressed that
this reconstruction is used here only to prove that much of the original image
information of the arti2.gif image is indeed still present in the soundscape - or
else the spectrographic reconstruction from the sound file would have failed
to be visually recognizable. The reconstruction does not intend or pretend to
model the processing by the human hearing system (although a windowed Fourier
reconstruction is not entirely unlike the cochlear frequency-to-place mapping).
For an example of a reconstruction from a sonified real-life image sequence see
the animation reconstruction experiment.
Fourier-type spectral reconstructions can also be done with the shareware program
![]() Cool Edit
by loading a .wav file and selecting its menu item View | Spectral View. Again
you will obtain results similar to The vOICe reconstruction as shown above,
although for best results one needs a logarithmic frequency scale such as
used by default in The vOICe Java application.
Cool Edit
by loading a .wav file and selecting its menu item View | Spectral View. Again
you will obtain results similar to The vOICe reconstruction as shown above,
although for best results one needs a logarithmic frequency scale such as
used by default in The vOICe Java application.
![]()
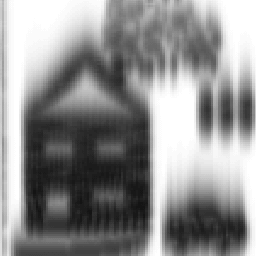
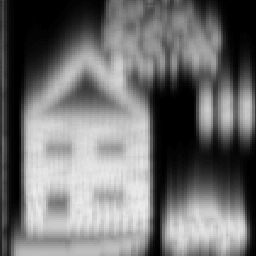
First, we will show so-called ``auditory spectrograms'' as generated by AIM using
the gensgm module. The gensgm module of the AIM software
performs a time-domain spectral analysis using a bank of auditory filters, and
summarises the results in an ``auditory spectrogram,'' i.e., a spectrogram with
auditory frequency resolution and temporal resolution instead of the
regular Fourier-based spectrograms commonly used in speech analysis (and in the
reconstruction given above). The auditory spectrogram is a plot of a sequence of
spectral slices extracted from the envelope of the basilar membrane motion. Contrary to
The vOICe convention, gensgm represents loudness by darkness rather than
brightness. In other words, one will get negative images from the AIM auditory
spectrograms of The vOICe's soundscapes:
 |
 |
|
|
|
 |
 |
|
|
|
The AIM auditory spectrogram at the top left was generated via
and the one at the top right has the default logarithmic compression turned off through thegensgm -width_win=512 -height_win=512 -mincf_afb=500 -maxcf_afb=5000 -gain_gtf=0.05 arti2ear.wav
compress and rectify options in
while the 512 × 512 pixel spectrographic images, specified by the display optionsgensgm -width_win=512 -height_win=512 -mincf_afb=500 -maxcf_afb=5000 -gain_gtf=1 -compress=off -rectify=on arti2ear.wav
width_win and height_win,
were afterwards sub-sampled by a factor two to obtain the 256 × 256
pixel images shown here. The relevant [500Hz, 5kHz] frequency display range
is selected using the mincf_afb and
maxcf_afb options, while a 20 kHz sample rate is the AIM default.
The gain_gtf option sets the output gain such that the spectrogram
is neither too dark nor too bright, because there is no automatic brightness
scaling in gensgm. The AIM software requires an additional
platform-dependent swap_wave option on some types of computer
platform to deal with different (big-endian) byte ordering conventions.
Basilar membrane motion (BMM) as a function of time can also be shown by using the AIM
genbmm module as shown below:
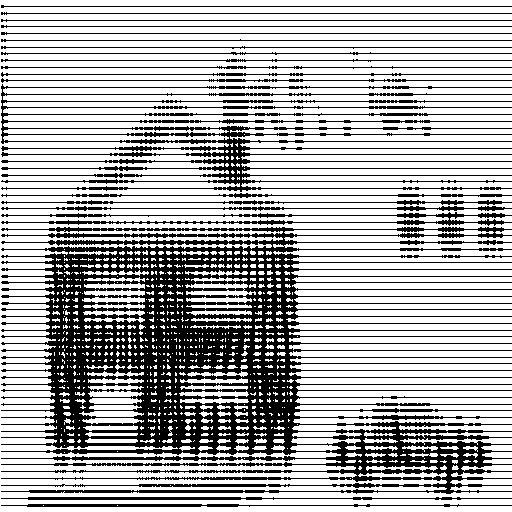 |
which was obtained through
where thegenbmm -length_wave=1050 -width_win=512 -height_win=512 -mincf_afb=500 -maxcf_afb=5000 -gain_gtf=0.005 arti2ear.wav
length_wave option sets the sound sample length to 1.05s,
expressed as the number of milliseconds.
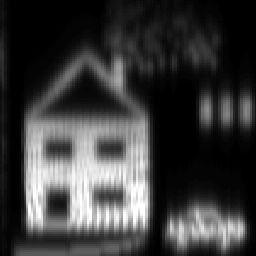
The neural activity pattern (NAP) in the auditory nerve can also be shown as a function of time
by using the AIM gennap module as shown below:
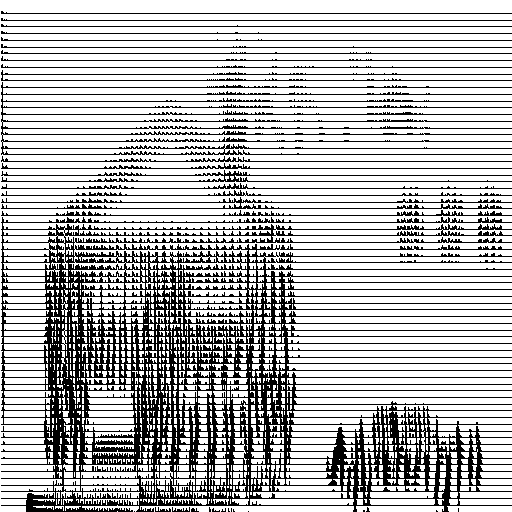 |
which was obtained through
using exactly the same options as with thegennap -length_wave=1050 -width_win=512 -height_win=512 -mincf_afb=500 -maxcf_afb=5000 -gain_gtf=0.005 arti2ear.wav
genbmm run.It is clear that if these results are approximately correct, and if the brain can (learn to) properly handle and interpret these firing patterns up to and including the higher cognitive centres, we are heading for something really exciting.
It should be stressed that there is still little consensus in the auditory research community about the (predictive, perceptual, and other) merits of any contemporary auditory model. Therefore, the above results with AIM should only be viewed as a first draft experiment for looking at some possible effects within the first stages in auditory processing using The vOICe's soundscapes. It is not known to what extent this bears any resemblance to reality, apart from one's own subjective impressions of perceived auditory resolution - therefore you had better listen to the soundscape yourself to make your own judgements. Auditory researchers and neuroscientists are welcome to make comments, propose improvements and either validate or invalidate the provisional results as presented here.
Literature:
Meijer, P.B.L., ``An Experimental System for Auditory Image Representations,'' IEEE Transactions on Biomedical Engineering, Vol. 39, No. 2, pp. 112-121, Feb 1992. Reprinted in the 1993 IMIA Yearbook of Medical Informatics, pp. 291-300. Electronic version available on-line.For other useful literature, see another list of references, or check out some of the technical aspects of the frequency-time uncertainty principle.Patterson, R.D., Robinson, K., Holdsworth, J., McKeown, D., Zhang, C. and Allerhand M. ``Complex Sounds and Auditory Images,'' Advances in the Biosciences, Vol. 83, pp. 429-446, 1992.
Patterson, R.D., Allerhand, M., and Giguere, C., ``Time-domain modelling of peripheral auditory processing: A modular architecture and a software platform,'' Journal of the Acoustical Society of America, Vol. 98, pp. 1890-1894, 1995. Text available
on-line.
Zatorre, R.J. and Belin, P. ``Spectral and temporal processing in human auditory cortex,'' Cerebral Cortex, Vol. 11, pp. 946-953, 2001. Abstract available
on-line.
Copyright © 1996 - 2024 Peter B.L. Meijer