The vOICe is also used by blind professionals for their daily work when access to
graphics is required. An example of that is the use by Tom Brennan, a congenitally
totally blind
![]() audiologist,
as reported on the AFB (American Foundation for the Blind) website in the context of
employment opportunities. As far as is known, he is the only totally blind audiologist
in the United States.
audiologist,
as reported on the AFB (American Foundation for the Blind) website in the context of
employment opportunities. As far as is known, he is the only totally blind audiologist
in the United States.
In education, it is important that blind students get access to the same learning material that their fellow students have. Until now, that required the preparation of special and costly tactile prints, because the regular books from the library were not accessible. For the plain text parts one may use a scanner with OCR, but for graphs there was no cheap solution. This page shows how The vOICe can help with learning math, physics, chemistry, biology and other sciences by pointing the camera to a page from a book and hearing out the contents of any graphs via visual data sonification.
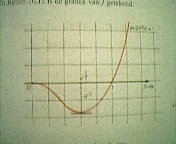 |
In the following example, the PC camera was pointed to a page from a mathematics book. The lens was focussed for nearby imaging after switching to negative video F5 to hear out dark lines on white paper - which is typical for graphs. Click the sound graph link or the image on the right to load a one-second MP3 stereo sound sample (18K) of the printed graph. You will hear a curve bending down and then upwards to a high pitch, as well as a horizontal fixed pitch line for the x axis and a repetitive sound for the drawing grid with some nine vertical lines. No attempt was made to get a high quality image, and sighted readers of this page can testify that the photograph has indeed pretty poor image quality. Still you can hear out the main graphical features much like the sighted can see them. For those familiar with math: the plot gives the curve of the function y = 2*x^2*ln(x) in an x-range from 0 through 1.6.
Note that this was really a quick-and-dirty snapshot, without trying to optimize anything. Also, much better results would have been obtained by acquiring a printed graph directly from a TWAIN compliant flatbed scanner. In addition to the things described above, you hear a high pitched rapidly interrupted tone for most of the soundscape except at the far right. This is a string of printed text that was still within view, but the characters are too small to be of any use. The same applies to a short text string describing the function expression at the upper right, just where the upgoing curve pitch ends. The x-axis tone actually sounds as two consecutive tones as you will notice. This is because no care was taken to properly align the camera and the line therefore steps up by one pixel: this is just a bitmap artifact and therefore it shows up in the visual bitmap as well. The background noise is simply the uniform color of the paper in negative video.
Make sure that your media player runs in autorepeat mode such that you can listen to each soundscape a number of times. With Microsoft Windows Media Player 9 and 10 you can toggle the repeat mode via Control T or via the menu Play | Repeat. With the older Microsoft Windows Media Player 6.4 you can go to the menu View | Options, select the Playback tab and then select "Repeat forever".
The soundscapes were created using The vOICe for Windows, and afterwards the saved .wav files were converted into MP3 format to reduce the file size for downloading. Other MP3 sound samples can be found on the Visual Orientation for the Blind page, the Walk towards Fence page, the Blindsight of a Parked Car page, the The vOICe of America page, the Planet Saturn page, the Access Symbol page and the Television for the Blind page.
See The vOICe Math Functions page for an overview of the built-in auditory function plot feature of The vOICe for Windows. This option can be used without a camera in case no printed graph is available. Note: in plotting the above function 2*x^2*ln(x) with the auditory graphing calculator, the x-range must start above zero, for instance using 0.01 through 1.3 for x, since the natural logarithm of zero or less does not exist and would give an error message. Check the "Fit range" checkbox to get a good range for the function value y.
Another approach to accessible graphics, based on programming image content, is described on the Blind drawing with Logo and The vOICe web page.
Useful information and guidelines on textually describing graphs and
graphics in Science, Technology, Engineering and Math (STEM) can be
found on the NCAM web page
![]() Effective Practices for Description of Science Content within Digital Talking Books.
Effective Practices for Description of Science Content within Digital Talking Books.