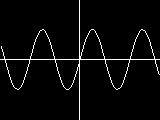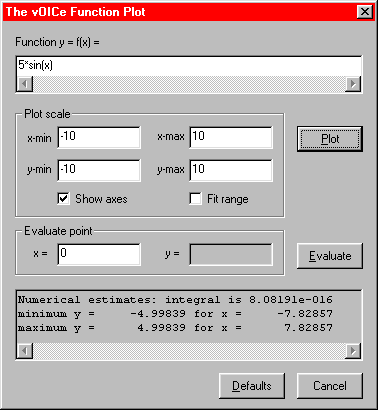

The auditory function plot option is to be used in combination with a suitable screen reader, using Control F2 to mute, if necessary. Pressing F8 opens the function plot dialog of the The vOICe's accessible graphing calculator. The dialog allows you to enter a function formula and set its x and y ranges, with optional function range fitting. Any user-defined function y of x gives an auditory function plot, or sound graph, with elevation y indicated by pitch in a left-to-right scan corresponding to a sweep of x. This procedure is in fact exactly the same as used with regular soundscapes of images, so there is no new or different mapping involved: it just corresponds to having a white curve on a black background, with the curve function specified by you. To give an illustration, the built-in example function 5*sin(x), or five times the sine of x, on an interval for x from -10 to +10, gives a sound as given in the following 44K soundscape file link. Note the extra fixed-pitch tone corresponding to the horizontal x axis, and the click in the middle corresponding to the vertical y axis.
The equivalent visual function plot is shown below on the left, with a screenshot of the auditory graphing calculator dialog, as activated by pressing function key F8, on the right.


From the dialog, you can also turn the axes on or off as preferred, and evaluate single points to obtain the numerical function value in an edit box. User settings are preserved across program runs, and you may temporarily leave the function plot mode by pressing the F8 toggle in order to change some other settings, such as the scan rate.
The following table lists the operators, functions, and constants that are supported by The vOICe auditory graphing calculator:
| Operator | Syntax | Description |
|---|---|---|
| Addition | + | x+y is x plus y |
| Subtraction | - | x-y is x minus y |
| Multiplication | * | x*y is x times y |
| Division | / | x/y is x divided by y |
| Modulus | % | x%y is remainder of division x/y, integer x,y |
| Exponentiation | ^ | x^y is x raised to the power of y |
| Function | Syntax | Description |
| Exponentiation | pow( , ) | pow(x,y) is power x^y, x>0 | x=0, y>0 | x<0, integer y |
| Sine | sin( ) | sin(x) is sine of x |
| Cosine | cos( ) | cos(x) is cosine of x |
| Tangent | tan( ) | tan(x) is tangent of x |
| ArcSine | asin( ) | asin(x) is sin-1(x), x in [-1,1] |
| ArcCosine | acos( ) | acos(x) is cos-1(x), x in [-1,1] |
| ArcTangent | atan( ) | atan(x) is tan-1(x) onto [-#pi/2,#pi/2] |
| ArcTangent2 | atan2( , ) | atan2(y,x) is tan-1 (y/x) onto [-#pi,#pi] |
| Hyperbolic Sine | sinh( ) | sinh(x) is hyperbolic sine of x |
| Hyperbolic Cosine | cosh( ) | cosh(x) is hyperbolic cosine of x |
| Hyperbolic Tangent | tanh( ) | tanh(x) is hyperbolic tangent of x |
| Hyperbolic Arcsine | asinh( ) | asinh(x) is sinh-1(x) |
| Hyperbolic Arccosine | acosh( ) | acosh(x) is cosh-1(x), x >= 1 |
| Hyperbolic Arctangent | atanh( ) | atanh(x) is tanh-1(x), |x| <= 1 |
| Square Root | sqrt( ) | sqrt(x) is square root of x, x >= 0 |
| Exponential | exp( ) | exp(x) is ex, base #e exponential function of x |
| Natural Logarithm | ln( ) | ln(x) is natural logarithm of x, x>0 |
| Logarithm | log10( ) | log10(x) is base 10 logarithm of x, x>0 |
| Logarithm | Log( , ) | Log(b,x) is base b logarithm of x, x>0, b>0 |
| Absolute Value | abs( ) | abs(x) is absolute value |x| |
| Modulus | mod( , ) | mod(x,y) is real remainder of x/y, y != 0 |
| Ceil | ceil( ) | ceil(x) is smallest integer >= x, as a real |
| Floor | floor( ) | floor(x) is largest integer < x, as a real |
| Round | round( ) | round(x) is rounded integer, as a real |
| Constant | Syntax | Description |
| Pi | #pi | constant, 4*atan(1) |
| TwoPi | #twopi | constant, 2 * #pi |
| E | #e | constant, exp(1) |
| Gamma | #gamma | Euler constant |
| Permittivity | #eps0 | permittivity vacuum (F/m), 8.854187783e-12 |
| Permeability | #mu0 | permeability vacuum (H/m), 4.0e-7 * #pi |
| Speed of Light | #c | speed of light in vacuum (m/s), 2.99792458e8 |
| Electron charge | #q | elementary charge (C), 1.6021892e-19 |
| Electron mass | #me | electron rest mass (kg), 0.9109534e-30 |
| Proton mass | #mp | proton rest mass (kg), 1.6726486e-27 |
| Planck | #h | Planck constant (J s), 6.626176e-34 |
| Avogadro | #na | Avogadro constant (1/mole), 6.022045e+23 |
| Boltzmann | #kb | Boltzmann constant (J/K), 1.380662e-23 |
Example of hearing plots from the free Octave mathematics package:
The following line contains Octave commands for making a simple graph of a sine wave, plotted over an interval from 0 through 10:The same kind of procedure can be applied with any third-party mathematics or plot package! The vOICe for Windows renders the graphs generated by any other software at least partially accessible through the general screen sonification features. Thus you can gain access to the results of advanced mathematics features that are not included in the built-in graphing calculator.
x = 0:0.1:10; plot (sin(x)); When this command is executed from the Octave command line, Octave will launch gnuplot and you will get a window labelled "gnuplot graph". This window shows the curve that we want to hear. So now you start The vOICe for Windows. Next, press F5 to get inverse video, because gnuplot by default uses a bright (noisy) background, and you can only hear bright (loud) lines on a dark (silent) background. Then press Alt F9 to get sonification of the active window, which at that point is still The vOICe for Windows's own window. Just "Alt tab" to the window labelled "gnuplot graph" spawned by Octave, and you will hear the sine wave!
Note: As an alternative to using The vOICe built-in scientific graphing calculator
function for doing mathematics, you may wish to also consider John Gardner's
![]() Audio Graphing Calculator
software for the blind, the IVEO software from
Audio Graphing Calculator
software for the blind, the IVEO software from
![]() Viewplus,
or Robert Shelton's
Viewplus,
or Robert Shelton's
![]() MathTrax from NASA
for sonified graphs. A European IST project aimed at making mathematics more accessible is the
MathTrax from NASA
for sonified graphs. A European IST project aimed at making mathematics more accessible is the
![]() LAMBDA Project.
For Matlab-specific scripts for Matlab graph sonification similar to The vOICe's general
active window sonification (Alt F9, F5), check out
LAMBDA Project.
For Matlab-specific scripts for Matlab graph sonification similar to The vOICe's general
active window sonification (Alt F9, F5), check out
![]() MIST (Matlab Interactive Sonification Toolbox)
by James Ferwerda of Cornell University.
For general approaches to and material for learning
math, including Nemeth codes, you are advised to visit the website of Susan Osterhaus on
MIST (Matlab Interactive Sonification Toolbox)
by James Ferwerda of Cornell University.
For general approaches to and material for learning
math, including Nemeth codes, you are advised to visit the website of Susan Osterhaus on
![]() teaching math to visually disabled students.
teaching math to visually disabled students.
A useful resource for advice and discussion is also the
![]() blindprogramming list
of Dennis Brown. An approach based on directly programming graphics content is described
on the Blind drawing with Logo and The vOICe web page.
blindprogramming list
of Dennis Brown. An approach based on directly programming graphics content is described
on the Blind drawing with Logo and The vOICe web page.
Copyright © 1996 - 2024 Peter B.L. Meijer